
Modbus-Tools
C++20 | Qt6 | Industrial Protocols
Based on the latest Modbus-Tools release. Updated 2026-04-21
In industrial automation and embedded development, Modbus is part of everyday work. The real challenge is how much time we spend on repetitive tasks during field commissioning: manually building frames, repeatedly checking logs, and converting raw register values one by one.
Modbus-Tools was built with a clear goal: make the high-frequency steps of sending frames, reviewing logs, and parsing data smoother to use. Rather than stacking features, it prioritizes debugging efficiency and usability. Internally it uses a layered channel / transport / session / parser design, with CI/CD, multi-language support, and auto-update capabilities for practical iteration.
Below is a walkthrough of the core features in typical usage order.
1. Fast connection and frame creation
Whether you are using Modbus RTU (serial) or Modbus TCP (network), connection parameters are in the left panel at a glance.
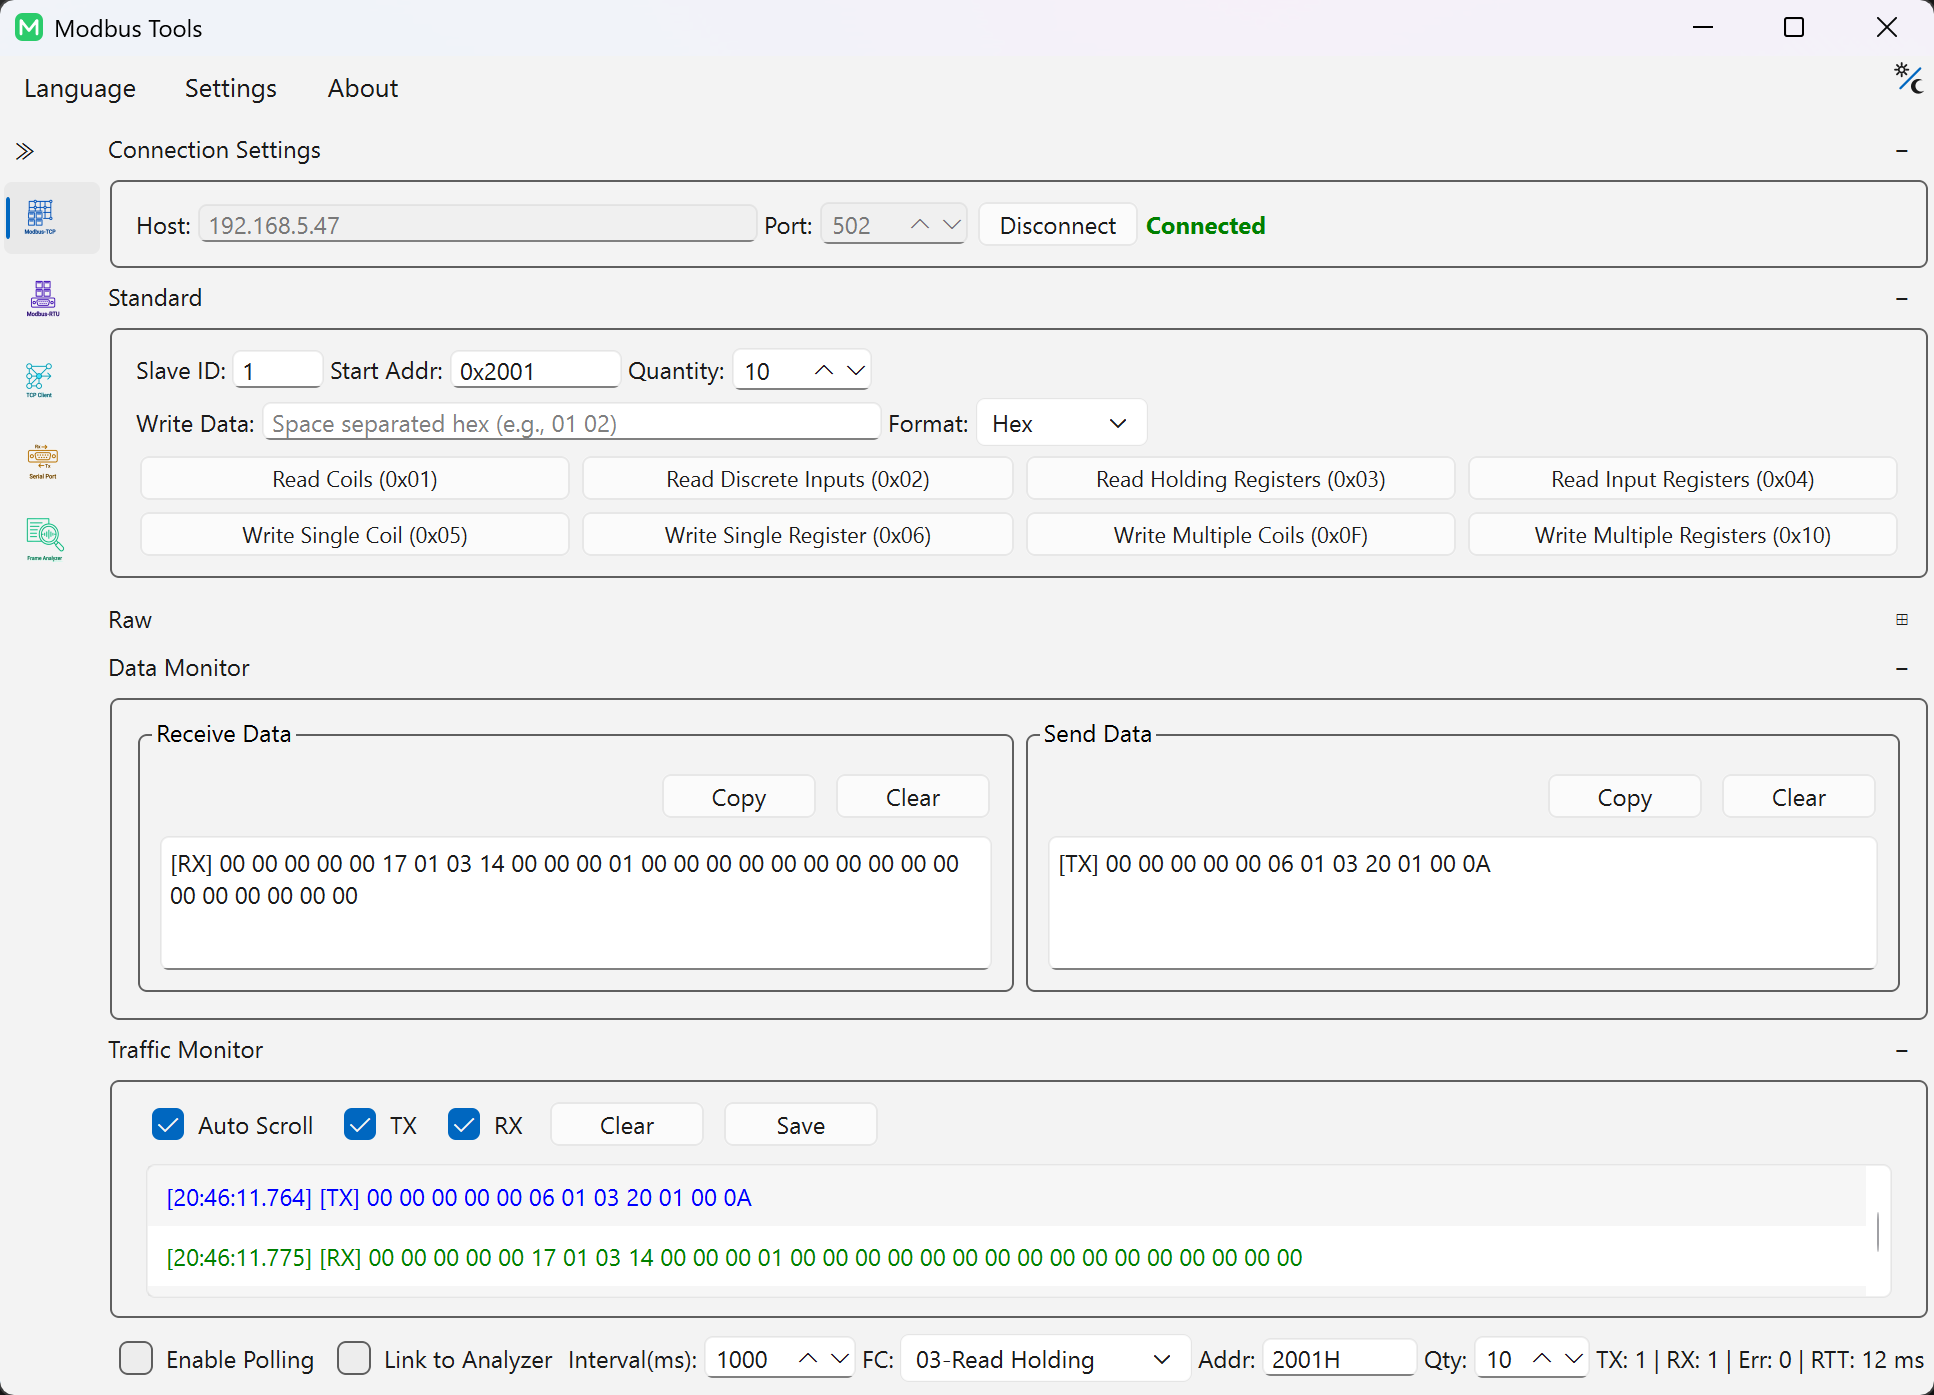
During debugging, the priority is rapid trial-and-error. Modbus-Tools separates parameter input from function code actions clearly:
- One-click function code actions: Fill
Slave ID,Start Address, andQuantity/Data, then click01/02/03/04/05/06/0F/10buttons to send. The underlying layer assembles frames and calculates CRC/LRC automatically. Function codes cover 0x01–0x04 (read), 0x05–0x06 (single write), 0x0F–0x10 (multiple write). - HEX / DEC smart recognition:
Slave IDandStart Addressaccept both HEX (e.g.,0x10,10H) and DEC (e.g.,16) formats, parsed uniformly byparseSmartInt()with range validation. - Writable data format switch (HEX / DEC / Binary): Use the
Formatselector next toWrite Datato switch betweenHex,Decimal, orBinaryinput styles. - Enhanced Raw mode: For custom Hex frames, switch to Raw input and send — suitable for non-standard scenarios or edge-case validation. Two auxiliary buttons are included:
- Append CRC (RTU): Automatically computes and appends a CRC16 checksum to the input field.
- Add MBAP (TCP): Automatically wraps the input with a Modbus TCP MBAP header (Transaction ID / Protocol ID / Length / Unit ID).
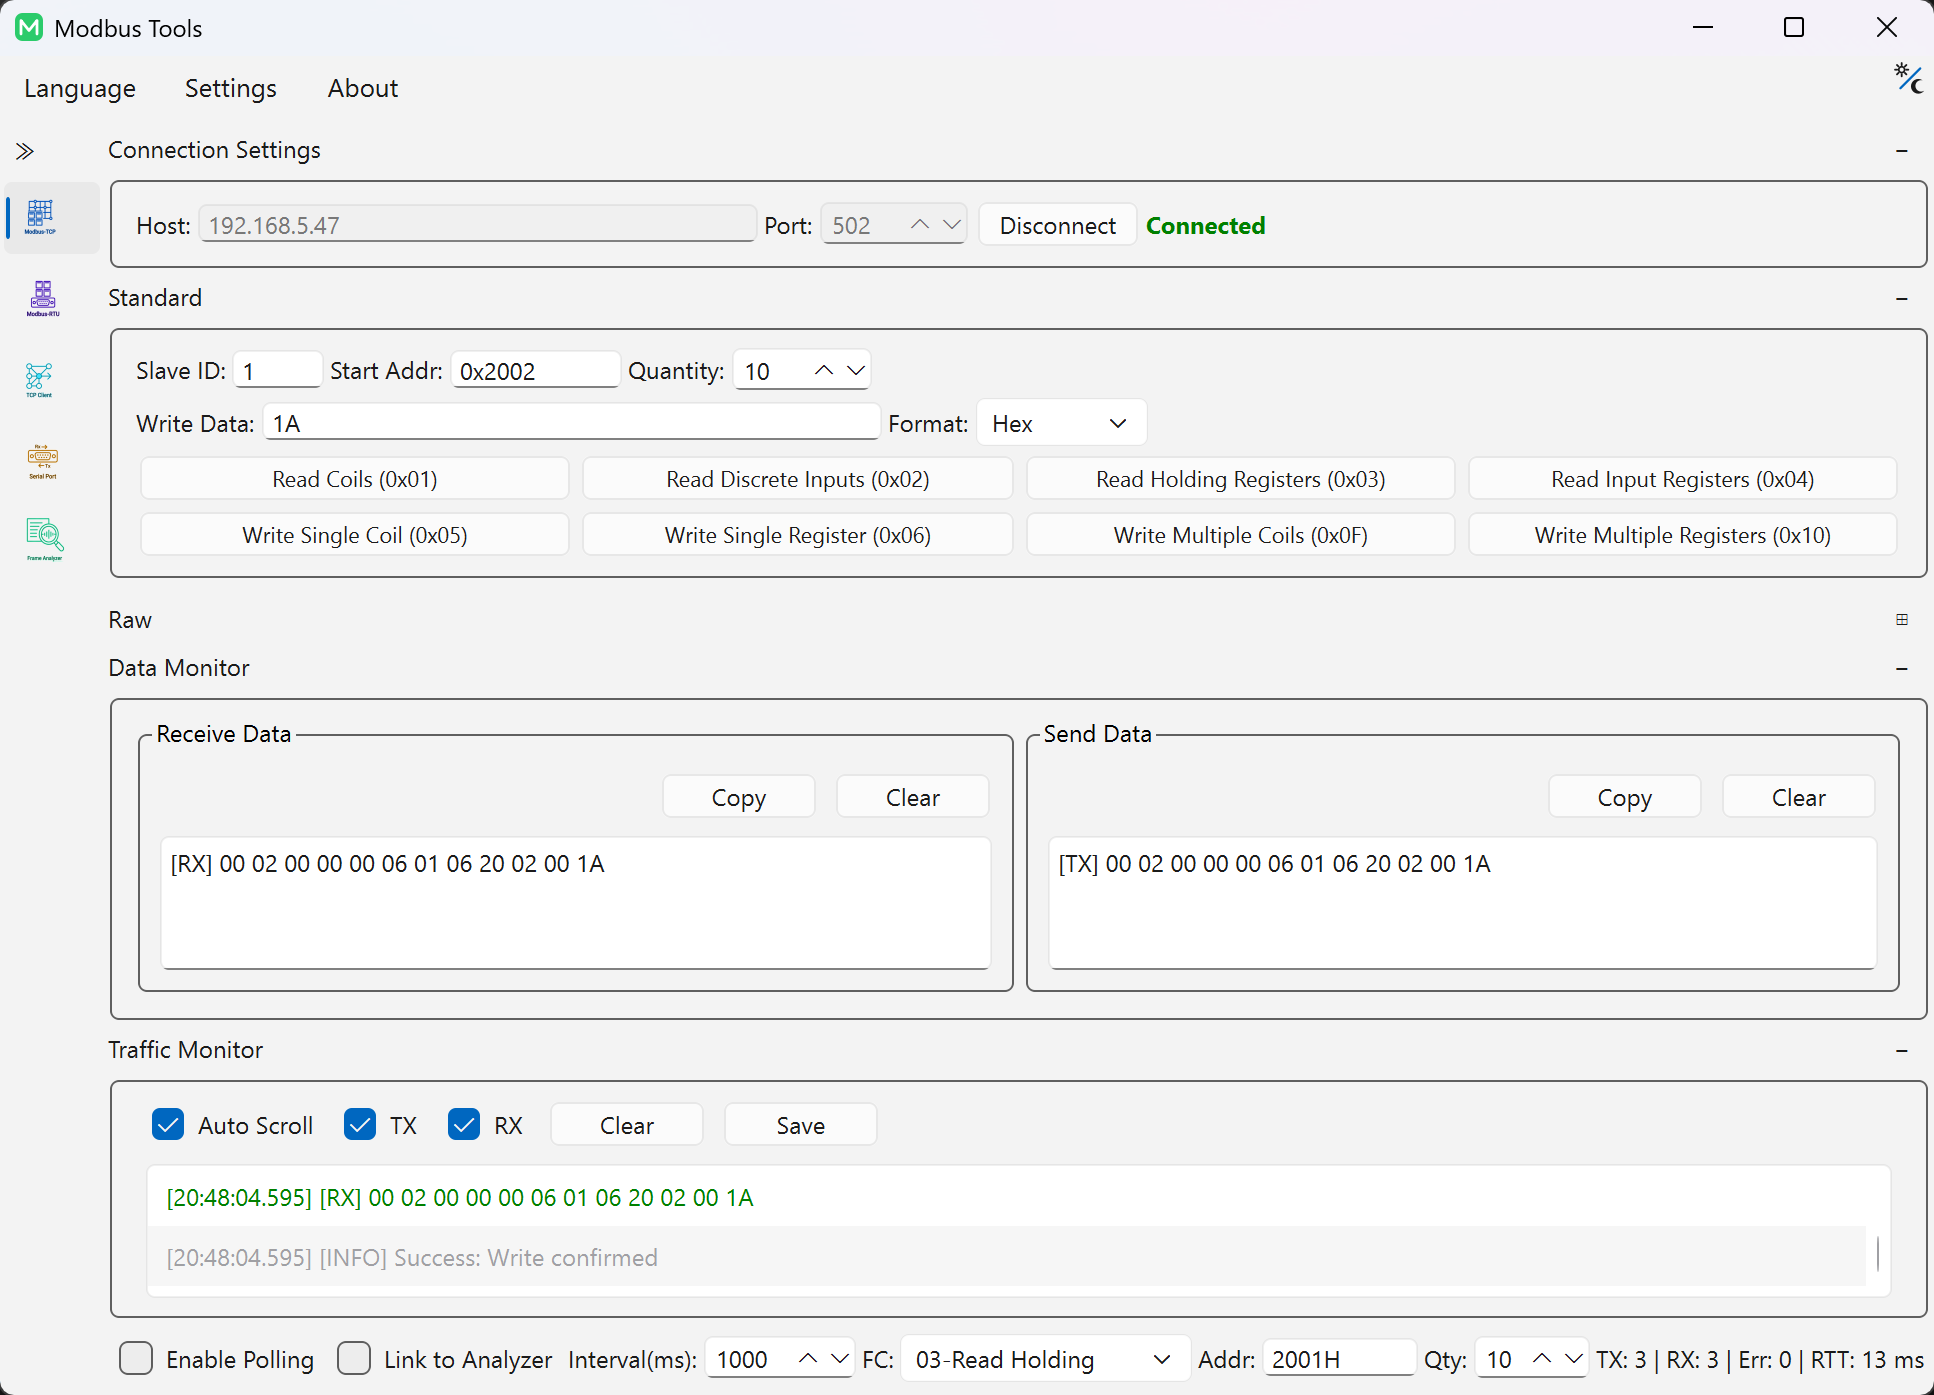
Coil (Coils) binary write interaction
For bit-level operations, the tool provides an intuitive Binary input mode:
- Binary input: Enter bit strings directly (e.g.,
1 0 1 1). The system auto-encodes and sends via0x05(single coil write) or0x0F(multiple coils write) function codes. - Bit-level read: Pair with
0x01/0x02read commands to verify remote device coil and discrete input states.
2. Log inspection and quick copy (Traffic Monitor)
Troubleshooting usually starts with logs. Traffic Monitor is designed to make log reading and sharing straightforward.
- Clear TX/RX separation: Sent and received frames are visually separated, with millisecond timestamps.
- One-click copy: Copy key frames quickly for issue reproduction, team discussion, or test records.
- Direction filters: Show only TX or only RX to focus in high-frequency polling scenarios.
- Log export: Save current communication logs for bug archives and field records.
3. Frame Analyzer: from Hex to useful values
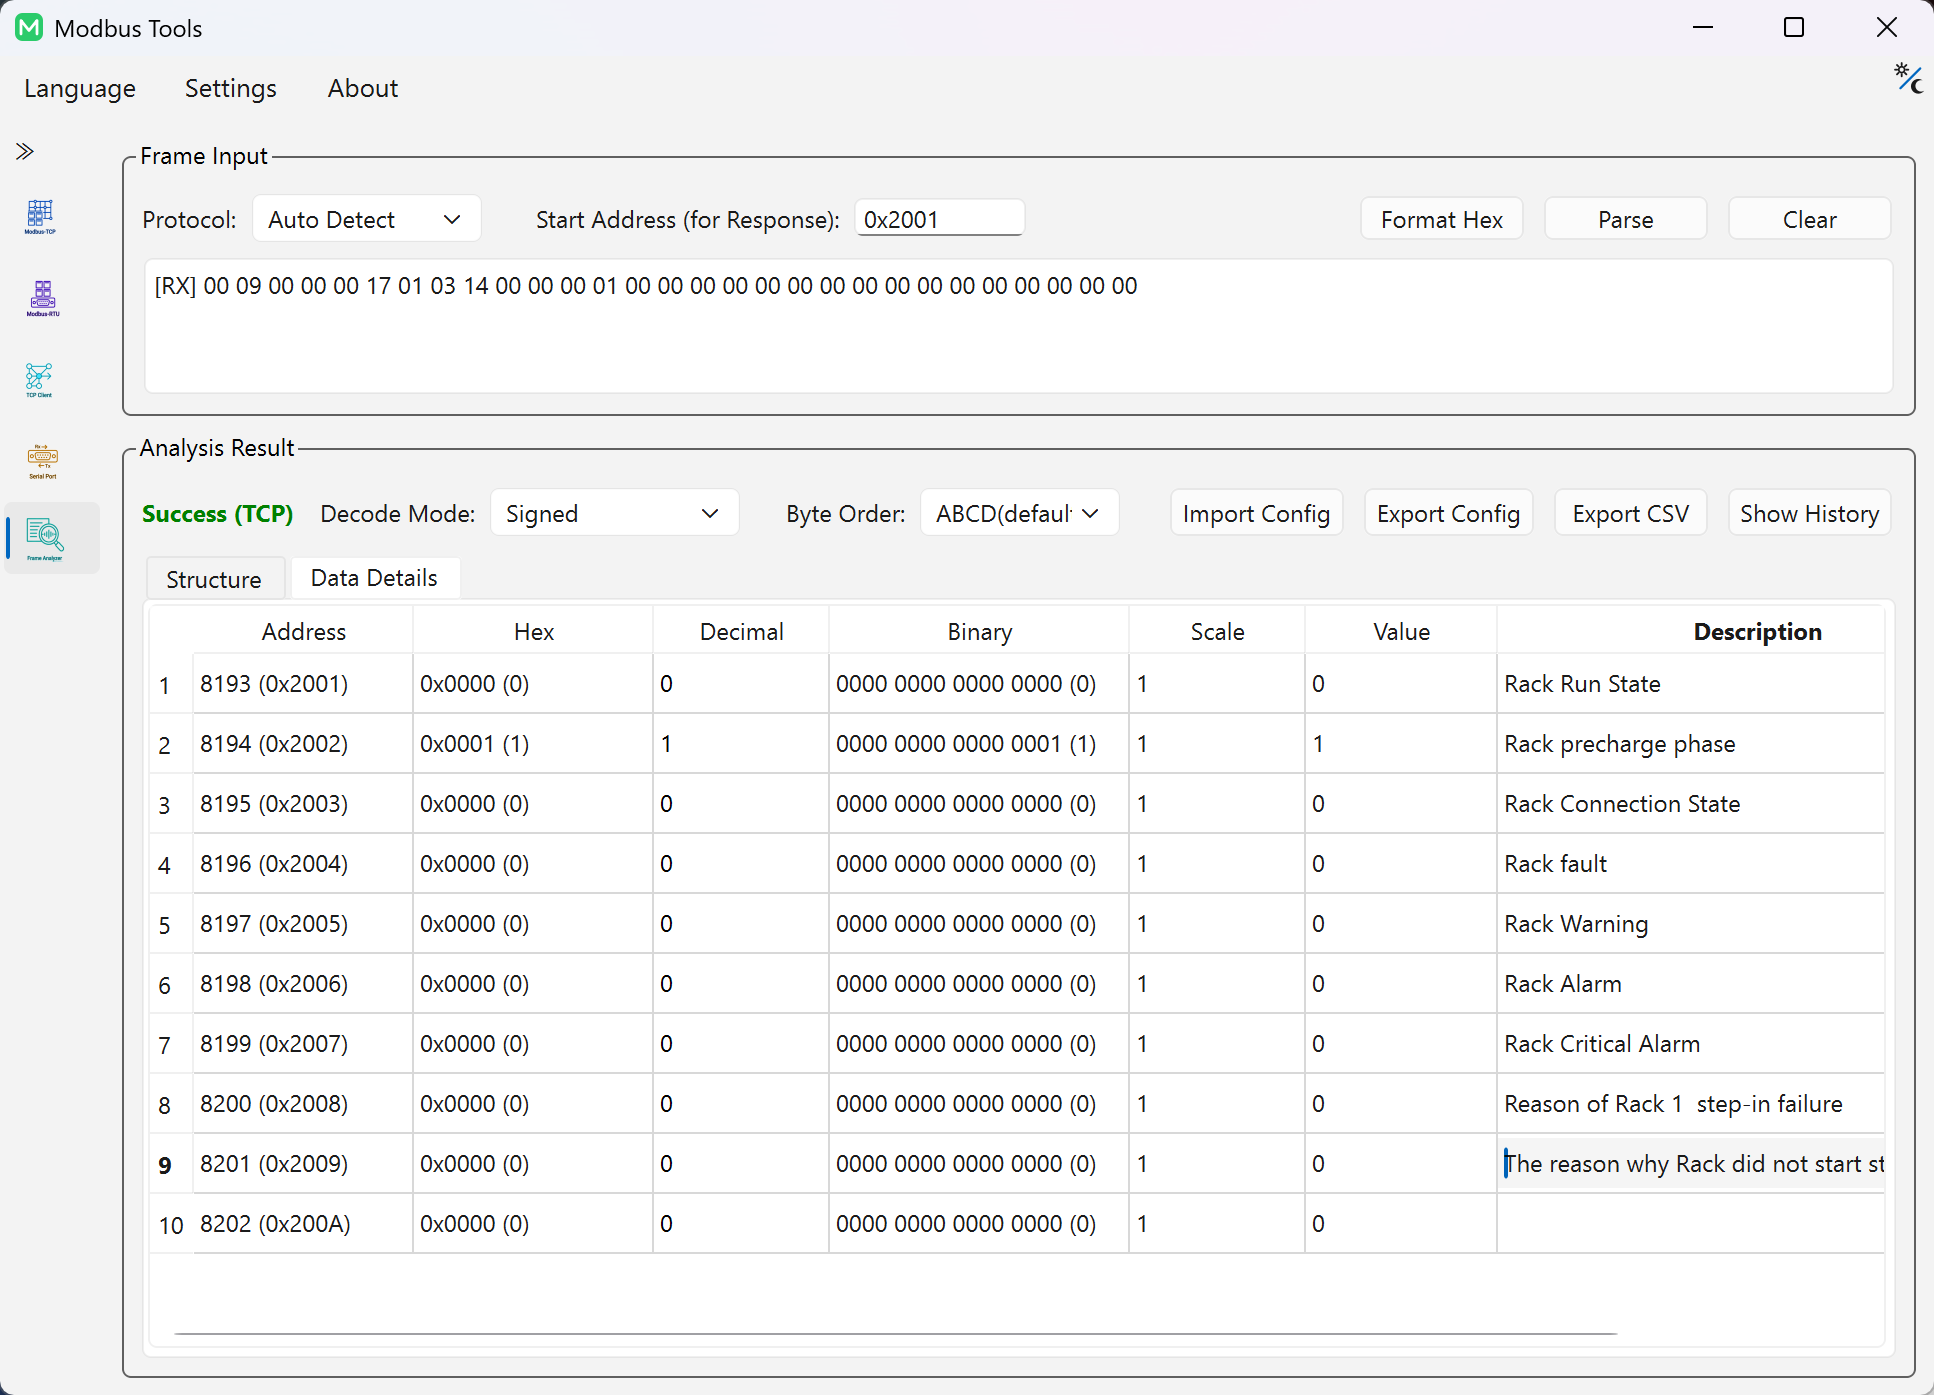
Frame Analyzer is one of the most frequently used modules. Paste a Hex frame, click parse, and get structured output with a readable table.
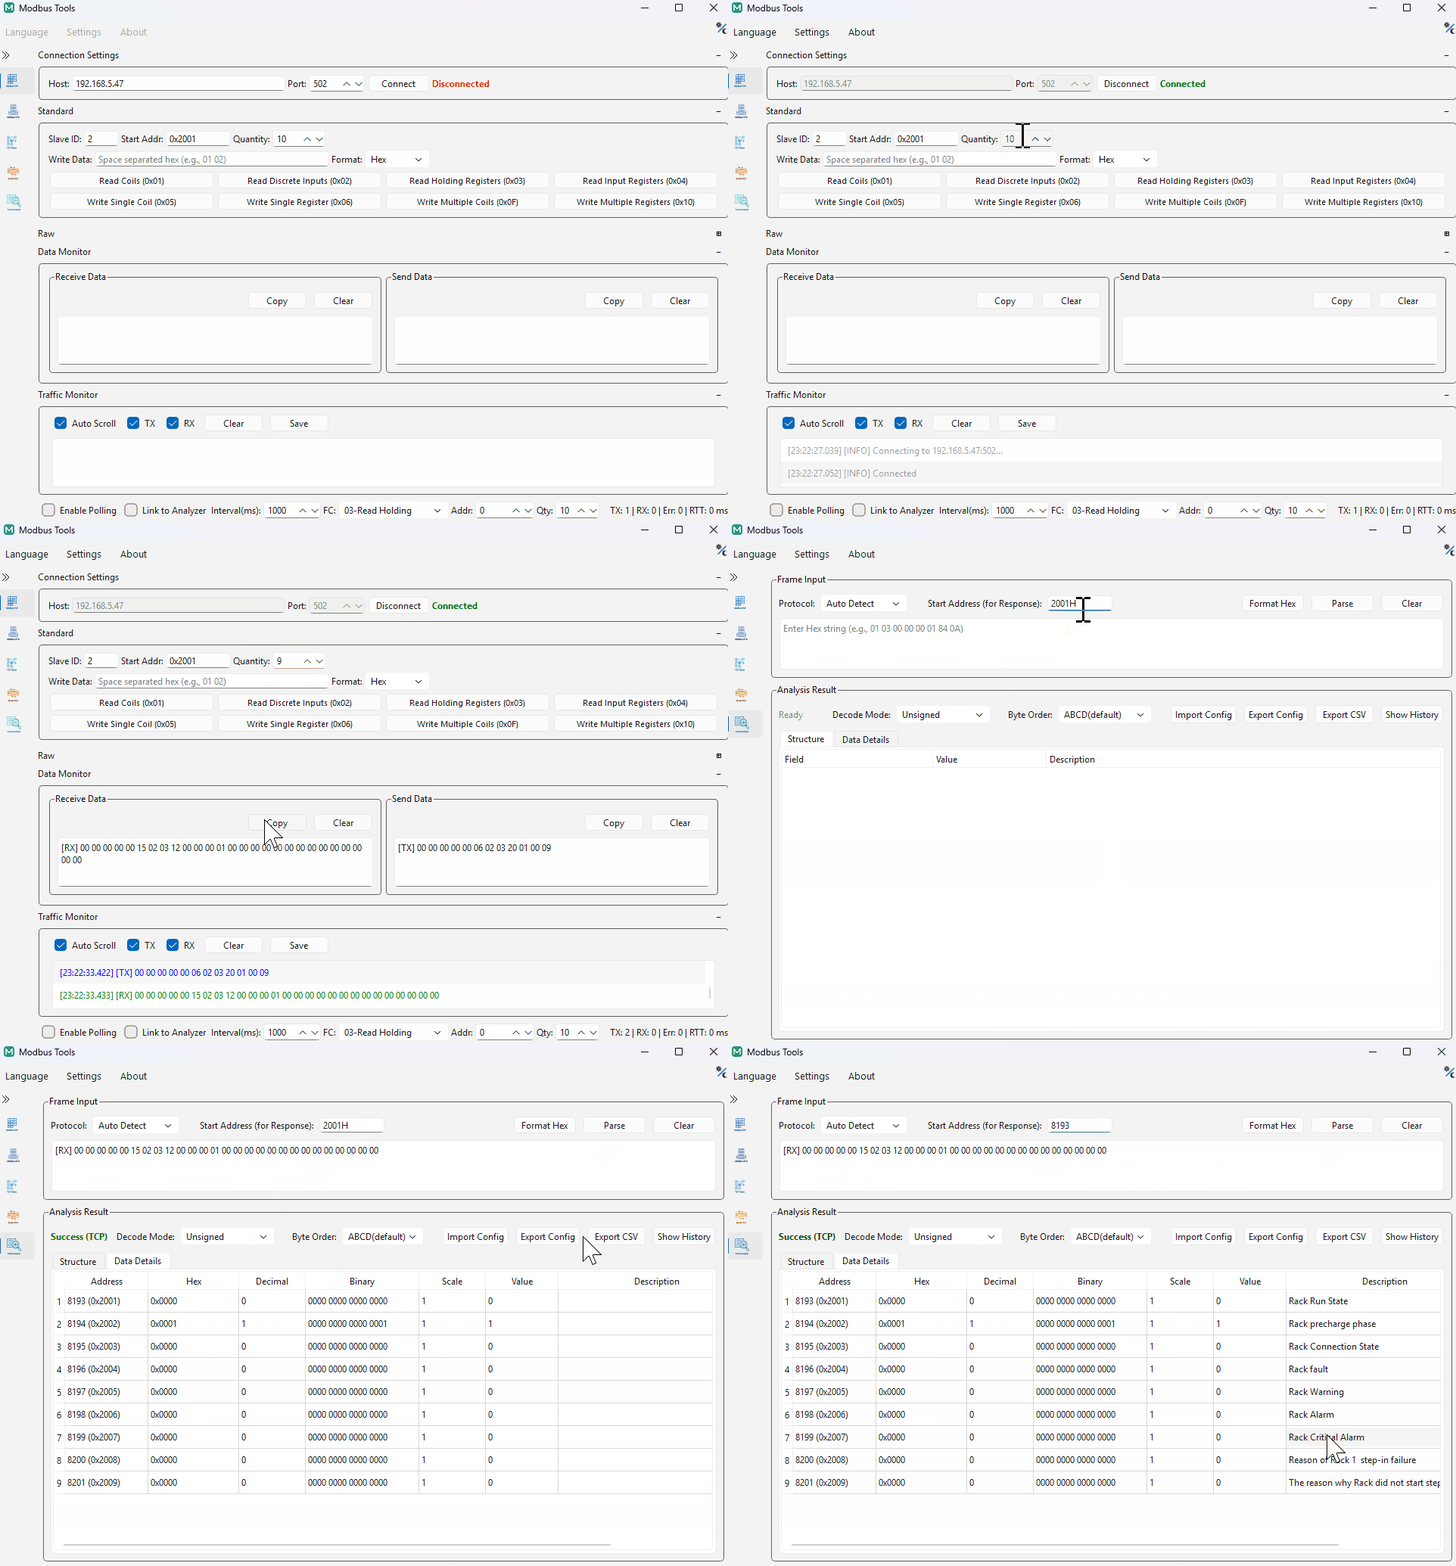
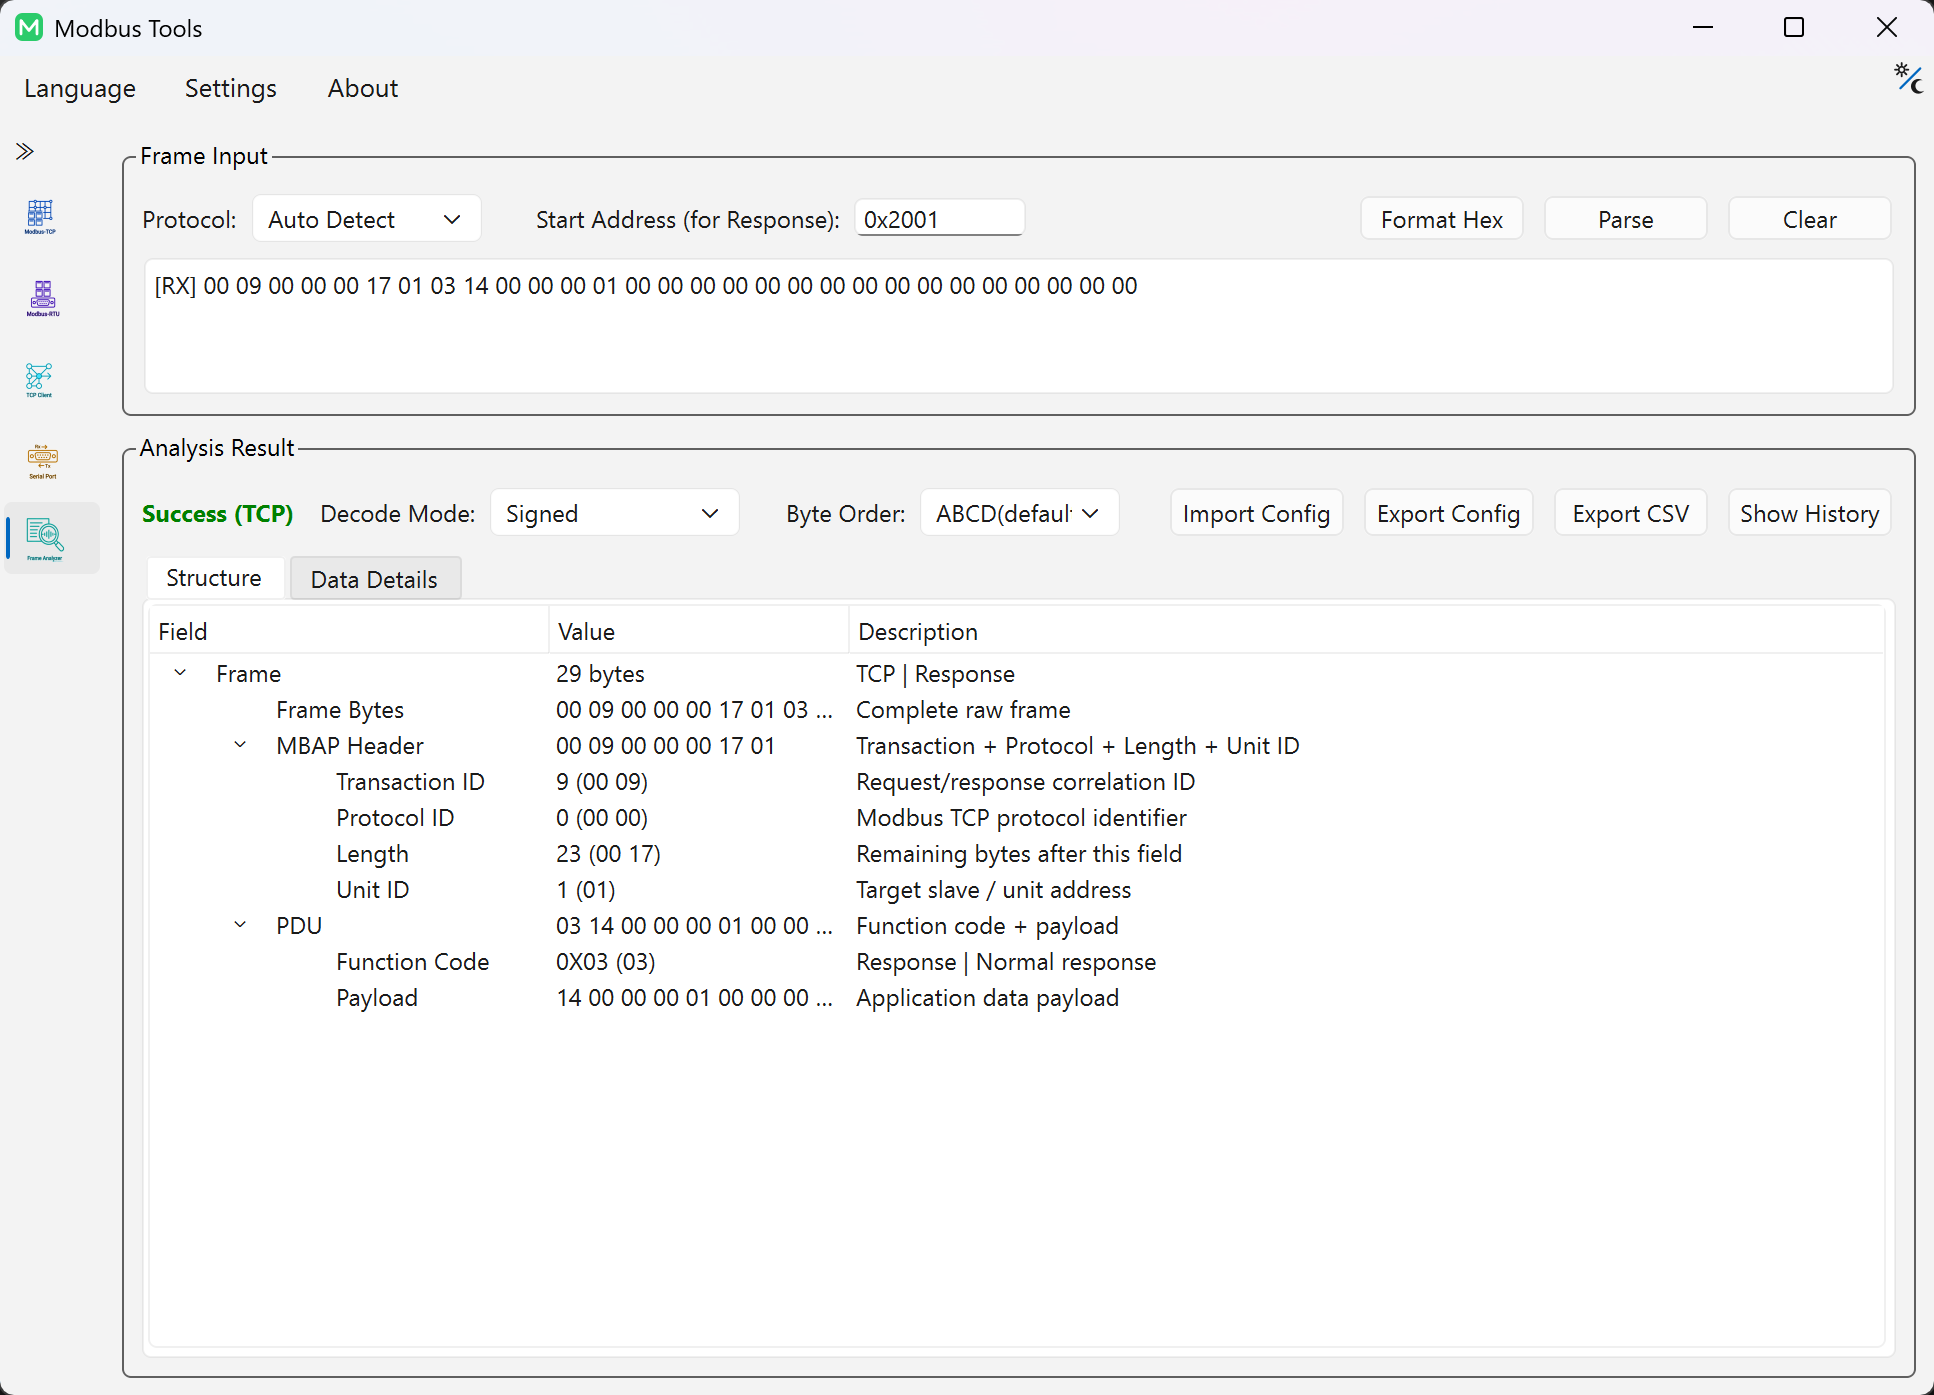
The following capabilities are especially useful:
Decode mode switch (Unsigned / Signed)
The toolbar provides Decode Mode with Unsigned and Signed. After switching, parsed values are refreshed immediately — decimal, hex, binary, and scaled output all update together. This is useful for signed telemetry such as negative temperature or reverse power.
Scaling (Multiplier)
Devices often send scaled integers (for example, 220.5V transmitted as 2205).
Set Scale per register (such as 0.1 or 0.01), and the analyzer shows engineering values in real time.
Byte order analysis (Byte Order)
Different PLCs and instruments may use different data layouts. The analyzer supports four byte/word order modes:
- ABCD (Big Endian): High bytes first.
- CDAB (Little Endian Byte Swap): Little-endian byte swap.
- BADC (Big Endian Byte Swap): Big-endian byte swap.
- DCBA (Little Endian): Low bytes first.
Switching byte order recalculates and redisplays register values.
Register annotations (Description)
Add descriptions like “Phase A Voltage” or “Motor Speed” to register addresses.
Values and meanings appear side by side, reducing time spent cross-checking spreadsheets.
Persistent config and JSON / CSV templates
Metadata can be saved and reused.
- Auto-save keeps your latest scaling and descriptions.
- JSON / CSV import/export lets you maintain per-device templates and import them when switching targets.
Other practical details
- Format Hex button: Cleans and normalizes pasted Hex text for better readability.
- Configurable response start address: Set
Start Addressfor response parsing to align with your register map. - Protocol selection:
Auto Detect / Modbus TCP / Modbus RTUhelps in mixed capture scenarios.
Force Parse
During field captures, frames may fail integrity checks due to truncation or modification by intermediate devices. When the user manually selects TCP or RTU in the Protocol dropdown (instead of Auto Detect), the parser enters force mode:
- RTU force mode: On CRC mismatch, instead of aborting with an error, it marks
checksumValid = false, logs"CRC Mismatch (Forced)"in warnings, and continues parsing PDU data fields. - TCP force mode: On abnormal MBAP length or trailing bytes, it logs the corresponding warning but still extracts PDU based on actual frame length.
This mechanism is useful for analyzing frames modified by gateways/relays or incomplete captures from serial sniffing tools. Auto Detect mode enforces strict checks, suitable for precise verification in normal communication scenarios.
Link to Analyzer (live linkage)
In addition to manual paste, Frame Analyzer can receive live data from Traffic Monitor:
- Auto-push: With the Linkage toggle enabled in Modbus TCP / RTU views, RX response PDUs are sent to the parser automatically — no manual copy needed.
- Pause / Resume: Click
Pause Refreshto freeze the current frame so you can edit Scale or Description; clickResume Refreshto resume auto-refresh. - Stop linkage: Click
Stop Linkto disconnect the data stream; the analyzer returns to manual mode. - Async execution: Parsing logic runs on a
QThreadbackground thread, non-blocking to Traffic Monitor list scrolling.
If you maintain multiple device models, saving per-device templates and importing them when switching targets reduces repeated configuration.
4. Handy extras
Beyond the core Modbus workflow, two lightweight helpers are available for ad-hoc tasks:
- TCP Client: For quick custom network message verification.
- Serial Port: For basic serial port send/receive testing (ASCII/Hex).
5. Engineering quality and test coverage
As an iterated open-source project, Modbus-Tools invests in code quality:
Automated tests
The project uses Google Test (GTest) and Google Mock (GMock) frameworks for automated quality assurance, covering:
- Session management: Connect/disconnect logic, request timeout retry, and exception state recovery.
- Protocol transport: TCP/RTU frame assembly/disassembly, checksum computation, and integrity verification.
- Parsing logic: Robustness validation against valid instructions and malformed frames.
- Data processing: Byte-order conversion, engineering-value scaling, and formatting algorithm accuracy.
Currently 42 automated test cases (TEST + TEST_F) covering session management, protocol transport, parsing logic, data processing, and formatting. Regression tests run on every Release.
CI/CD integration
- GitHub Actions pipeline integrates MSVC AddressSanitizer (ASan) for automated memory corruption and leak detection.
- Supports automatic build, test, and Release artifact distribution.
Auto-update (OTA)
The tool integrates a GitHub Releases-based auto-update mechanism: silent version check at startup + manual check from the menu bar. Update packages are verified via SHA256 before replacement, supporting both UpdateOnly (incremental) and Full Package modes.
Final notes
The design goal of Modbus-Tools is to encapsulate high-frequency debugging operations (send frames, review logs, parse data) into reusable workflows, allowing developers to focus more on business logic and issue diagnosis.
Feature summary:
- Fast framing: HEX/DEC smart recognition (
parseSmartInt) + Raw mode CRC/MBAP helper calculation. - Live linkage: Link to Analyzer supports auto-push of RX frames to the parser.
- Deep analysis: Scaling (Scale Factor) + four byte orders (ABCD/BADC/CDAB/DCBA) + register descriptions.
- Bit-level control: Coil Binary input mode, supporting 0x05/0x0F function codes.
- Quality assurance: 42 automated tests + CI/CD integrated with MSVC AddressSanitizer.
If you work on embedded firmware or host-side tools, feel free to try it and share feedback in the GitHub repository.